
A Rapid City family earning close to the city’s own median income, with a mortgage close to the city’s own median home price, needs somewhere between roughly $1 million and $1.6 million in life insurance, depending mainly on how many years of income they choose to replace. That’s not a number pulled from a national calculator’s default settings. It’s what the DIME method (Debt, Income, Mortgage, Education) produces once you plug in Rapid City’s own numbers instead of a generic national average. This guide walks through where those numbers come from, works the math step by step for a real Rapid City household, and shows you how to run the same calculation for your own family.
The short version
- Rapid City's median household income is $75,467 and its median home value is $344,200, according to the U.S. Census Bureau's 2024 American Community Survey 1-year estimates, as reported by Census Reporter.
- A flat "10 to 15 times income" rule is a fine sanity check, but it ignores your actual mortgage, debts, and family size. The DIME method uses those specifics instead.
- For a two-child Rapid City household near the city's median income and home value, the DIME method lands near $1.25 million with a 13-year income-replacement window, and swings between about $1.02 million and $1.62 million depending on that window alone.
- Fifty-nine percent of private industry workers have access to employer life insurance, per the U.S. Bureau of Labor Statistics, but that coverage is usually a flat amount or a modest salary multiple, and it ends when the job does. Military households near Ellsworth Air Force Base have a similar resource in SGLI, with the same limitation.
- Nationally, only 51% of Americans own life insurance and about 100 million adults say they need it, according to LIMRA's 2025 research, down from 63% ownership in 2011.
Why a national calculator gives Rapid City families the wrong number
Search “how much life insurance do I need” and most calculators ask for your age and income, then hand back a multiple built around national averages. The trouble is that a national average bakes in national housing costs, and Rapid City’s housing costs aren’t quite national, but they’re also not what a lot of people assume for South Dakota. The city’s median home value is $344,200, according to the Census figures cited above, which sits below the $410,700 median sales price for new houses sold nationally in the second quarter of 2026, according to the U.S. Census Bureau and Department of Housing and Urban Development data reported by the Federal Reserve Bank of St. Louis, but not by nearly as much as some other South Dakota cities. That’s not a perfectly matched comparison, existing owner-occupied home value against new-construction sale price, but it tells you something useful: a national calculator’s mortgage assumption will undershoot what a lot of Rapid City families actually owe far less than it would for a lower-cost market, and it can still overshoot for a family who bought years ago or put a larger amount down. Either way, the fix is the same. Use your own mortgage balance, not a default.
The Black Hills housing market has its own pressures a national tool has no way to see: proximity to Ellsworth Air Force Base, a tourism-driven service economy that shapes seasonal income for a lot of households, and a limited supply of buildable land against the hills themselves. None of that changes the method. It changes which numbers you should plug into it.
The coverage gap, nationally and at home
Before the local math, it helps to see how common the underinsurance problem actually is. Only 51% of Americans own life insurance, down from 63% in 2011, and roughly 100 million adults say they need coverage they don’t have, according to LIMRA’s 2025 research on the industry’s coverage gap. Cost is the biggest reason people give for not buying, and LIMRA’s broader research has repeatedly found that a large share of the public overestimates what coverage actually costs.
That last figure matters more than it looks. Fifty-nine percent of private industry workers have access to some employer life insurance, according to the Bureau of Labor Statistics’ Employee Benefits in the United States release for March 2025. Access isn’t the same as adequate coverage. Group life at work is real, but it’s typically a flat dollar amount or a modest multiple of salary, and it stops the day you leave the job, whether you choose to leave or the job leaves you. A similar pattern shows up for the military households stationed at Ellsworth: Servicemembers’ Group Life Insurance is a real, valuable benefit while on active duty, but it doesn’t automatically continue after separation or retirement without converting to Veterans’ Group Life Insurance inside a set window. Treat either one as one resource in the math below, not the whole plan.
Start with what you’re actually protecting
Life insurance isn’t really about you. It’s about the people and obligations that depend on your paycheck. Before you land on a number, write down what your household would actually have to handle if your income stopped tomorrow:
- Income replacement — the years of earnings your family currently depends on.
- The mortgage — for most Rapid City homeowners, the single largest debt on the books.
- Other debts — a vehicle loan, credit cards, a co-signed student loan.
- Education — daycare and school costs now, college or trade school later, if that’s a goal you’re funding.
- Final expenses — funeral and estate-settlement costs, which land at the worst possible moment if nobody planned for them.
Then subtract what you already have working in your favor: existing life insurance, including any group coverage through work or SGLI through the military, and savings set aside specifically for your family. What’s left over is the gap a policy is meant to close.
This is general education, not financial or insurance advice
Nothing in this guide evaluates your specific finances or recommends a particular coverage amount, carrier, or product. It's a transparent method and a worked example so you can run your own numbers with a clear head before you talk to anyone.
Two ways to size it: the flat multiple, and DIME
There are two common approaches, and it’s worth understanding both so you know what you’re actually being handed when someone gives you a number.
The income multiple. Many advisors start around 10 to 15 times your annual income as a rough target. It’s quick, and it builds in some cushion, but it treats a single person with no debt the same as a family with a mortgage, two kids, and a decade of daycare ahead of them. It’s a sanity check, not a plan.
The DIME method. This adds up four specific buckets that reflect your actual household:
- D — Debt. All debts other than the mortgage: vehicle loans, credit cards, a co-signed loan, anything you personally owe that wouldn’t disappear if you did.
- I — Income. Your annual income multiplied by the number of years your household would need it replaced.
- M — Mortgage. Your remaining mortgage balance, not the original loan amount.
- E — Education. What you intend to put toward your kids’ education, if that’s part of your plan. If it isn’t, this bucket is zero.
Add those four together, then subtract savings and any existing coverage. What’s left is a target built from your own numbers instead of a rule of thumb. Big Sioux Life’s life insurance needs calculator runs this same math in a couple of minutes if you’d rather work it there than on paper.
Why the mortgage gets its own bucket
For most Rapid City homeowners, the mortgage is the largest single number in this whole calculation, and keeping the family in the house is usually the goal people care about most. If that's your main concern, our mortgage protection page walks through coverage sized specifically to a loan balance and term.
What it costs to get wrong
Here’s the part a lot of people skip past. Say a Rapid City household relies entirely on one parent’s group life insurance at work, a flat amount equal to roughly one year of salary, call it $75,467 to match the city’s median income. If that parent dies and the family’s real DIME-calculated need is closer to $1.25 million (the worked example below shows exactly how that figure is built), the shortfall is well over $1 million. That gap doesn’t show up as a bill. It shows up as a surviving spouse selling the house, pulling kids out of activities, or draining a retirement account over the next decade to cover what the group policy never touched.
| Coverage source | Amount | Gap vs. DIME target |
|---|---|---|
| Employer group life only (illustrative, ~1x income) | $75,467 | — |
| DIME-calculated target (worked example below) | $1,245,604 | — |
| Shortfall if only group coverage is in force | — | $1,170,137 |
Illustrative example built on Rapid City's median household income (Census Reporter, ACS 2024 1-year estimates) and the worked DIME calculation below. Not a quote or a specific policy comparison.
This is precisely the scenario the DIME method exists to catch before it happens, not after.
A worked example: a Rapid City family
Let’s make this concrete with a real Rapid City household. Picture a family with two kids, ages 5 and 9, one parent earning close to the city’s median household income of $75,467, a mortgage on a home near Rapid City’s median value of $344,200, $10,000 in other debt between a car loan and a credit card balance, $20,000 in savings set aside for the family, and a $75,467 group life policy through work (roughly one year of income, consistent with how employer coverage typically works). They want to replace income for 13 years, until their youngest is 18, and set aside $50,000 toward future education costs.
Assume they bought their home a few years ago and have paid the balance down modestly since, leaving a round $300,000 mortgage balance today. Every dollar figure below that isn’t sourced to Census Reporter or the Bureau of Labor Statistics is a stated assumption for this specific example, not a fact about any real family.
| Bucket | Basis | Amount |
|---|---|---|
| D — Debt | Car loan + credit card, illustrative | $10,000 |
| I — Income | $75,467 × 13 years | $981,071 |
| M — Mortgage | Illustrative balance near Rapid City's median home value | $300,000 |
| E — Education | Illustrative family goal | $50,000 |
| Subtotal (needs) | $1,341,071 | |
| Minus savings | Illustrative | −$20,000 |
| Minus existing group life | ~1 year of income | −$75,467 |
| Estimated coverage target | ≈ $1,245,604 |
Illustrative worked example. Income and home-value inputs from U.S. Census Bureau ACS 2024 1-year estimates via Census Reporter; all other figures are stated assumptions for this example, not averages or forecasts.
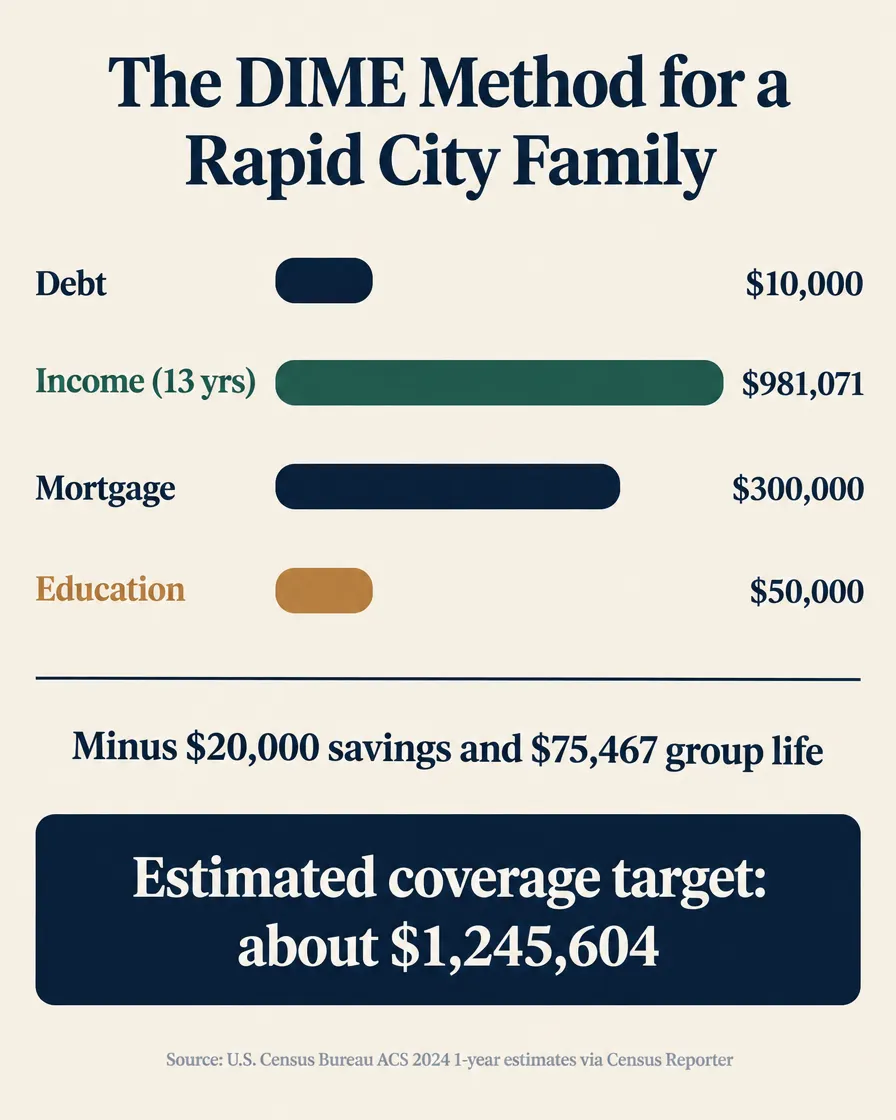
Where the coverage goes in the worked Rapid City example
Illustrative worked example using the DIME method; not a quote. Bars scaled to dollar amounts.
The income-replacement bucket dwarfs everything else, which is normal. It’s also the one number in the whole calculation that’s a judgment call, not a fact, which is exactly why it’s worth testing against a few different assumptions before you settle on one.
Why the replacement window matters more than any other input
Change how many years of income you’re replacing, and the whole target moves by hundreds of thousands of dollars, while every other bucket stays fixed. Here’s the same Rapid City family’s numbers with three different replacement windows:
| Replacement window | Income bucket | Total coverage target |
|---|---|---|
| 10 years | $754,670 | ≈ $1,019,203 |
| 13 years (worked example above) | $981,071 | ≈ $1,245,604 |
| 18 years | $1,358,406 | ≈ $1,622,939 |
Illustrative sensitivity table using the same DIME inputs as the worked Rapid City example above, varying only the income-replacement window.
There’s no universally correct window. A common approach is to replace income until your youngest child would realistically be financially independent, roughly 18 to 22 depending on whether college is part of the plan, though some households choose a shorter window if a surviving spouse has strong earning potential of their own, or a longer one if a parent plans to stay home with kids for years. The honest move is to pick the number that matches your actual plan, not the number that produces the premium you’d prefer to pay.
What Rapid City’s own numbers change about this math
A few things about Rapid City specifically are worth naming directly, because they change the calculation in ways a generic national guide won’t mention.
The mortgage bucket runs closer to the national picture here than in a lot of the state. Rapid City’s median home value is $344,200, according to the Census Bureau’s 2024 American Community Survey 1-year estimates, reported by Census Reporter. A separate Data USA profile of the same underlying Census data, using a different estimate vintage, put the figure at $299,400, with median household income at $70,870 rather than $75,467. Both readings tell the same basic story: Rapid City homes and incomes run higher than in some other South Dakota cities, and the gap to the national new-home median of $410,700 is real but smaller than it is elsewhere in the state. If you’re using a generic online tool that defaults to a national average home price, override it with your own balance either way, since the point of the DIME method is your number, not a market average in either direction.
South Dakota has no state income tax to account for. In a state that taxes income, you’d typically trim the income-replacement figure to reflect that a surviving family wouldn’t need to replace the portion that would have gone to state taxes anyway. South Dakota levies no state personal income tax, according to the South Dakota Department of Revenue, so a Rapid City household can run the income-replacement bucket against gross income without that extra adjustment, one less variable to guess at.
Ellsworth Air Force Base and a tourism-driven economy both shape local income patterns. The Black Hills draw seasonal tourism traffic that supports a meaningful share of Pennington County jobs in hospitality, retail, and recreation, work that can carry real income swings between summer and winter. Ellsworth Air Force Base, home to the 28th Bomb Wing, adds a steady population of active-duty families whose income and benefits look different from a typical civilian household. Neither situation breaks the DIME method. If your household income varies seasonally, average the last two or three years rather than using a single strong or weak season for the income bucket. If you’re a military family, run the same four buckets, but subtract SGLI the same way this guide subtracts employer group life, and remember it doesn’t automatically travel with a permanent-change-of-station move the way a portable individual policy would.
Seasonal or military income makes the income bucket harder, not impossible
If your household's income varies from season to season, average the last two or three years of tax returns rather than using a single good or bad year. If you're a military family relying on SGLI, treat it as a resource you subtract from the total, the same way this guide treats employer group life, and check the VGLI conversion deadline before you separate or retire so you don't have a gap while you shop for individual coverage.
Don’t forget final expenses
The DIME method’s four letters don’t explicitly include the cost of a funeral and settling an estate, and it’s easy to let that fall through the cracks. The Insurance Information Institute recommends planning for a minimum of $15,000 for final expenses as a starting figure, a number worth building into your total rather than assuming savings will cover it after the fact, since savings are often the first thing a grieving family draws down for other costs in the weeks right after a death. If sizing final expenses specifically is your main concern rather than the full income-replacement picture, our dedicated guide on final expense planning walks through the fuller cost range, and the final expense planner tool can help you land on a realistic number for that piece alone.
Term or permanent: which type fits the number you just calculated
Once you have a target, the next decision is what kind of policy gets you there without straining your budget. Term life insurance provides the largest death benefit per premium dollar, which is why most families protecting a temporary window, the working years and the mortgage term, start there. A 20- or 30-year term policy can cover a DIME-sized target like the one above at a premium that fits inside a normal monthly budget far more often than people expect, since term pricing is built around a set period and a level death benefit rather than lifelong coverage with a savings component. As one illustration of how far that death benefit can stretch, not a quote for your own situation, State Farm’s own published “starting at” online rate for 20-year term with $250,000 of coverage was $15.22 a month as of September 2026, for a 25-year-old female in excellent health in Illinois. A DIME-sized target like the Rapid City example above is usually built from several such term policies layered together, or one larger policy, rather than a single $250,000 block, but the per-dollar cost of term coverage is the reason it’s the starting point for most families sizing a number this large.
Permanent coverage such as whole life costs more per dollar of death benefit, because it’s designed to last your entire life and build cash value along the way rather than expiring at the end of a set term. Some families blend the two: a large term policy sized to the working years and the mortgage, alongside a smaller permanent policy for a lifelong goal like final expenses. There’s no universally right answer here, since it depends on how long you actually need the coverage and what your budget supports. Our data-driven term vs. whole life comparison breaks the full tradeoff down if you want to go deeper on that specific decision.
How we help
We’re an independent agency, which means we’re not limited to one carrier’s underwriting or one carrier’s pricing. Once you’ve got a DIME target you can defend, whether that’s the number from this guide’s method or the output of our needs calculator, we compare term and permanent options across the carriers we work with and help you land on coverage that fits the number and the budget, not just one or the other.
A ten-times-income guess is a starting point. Four buckets built from your own numbers is a target you can actually defend.
Mike Moore, Life Insurance Advisor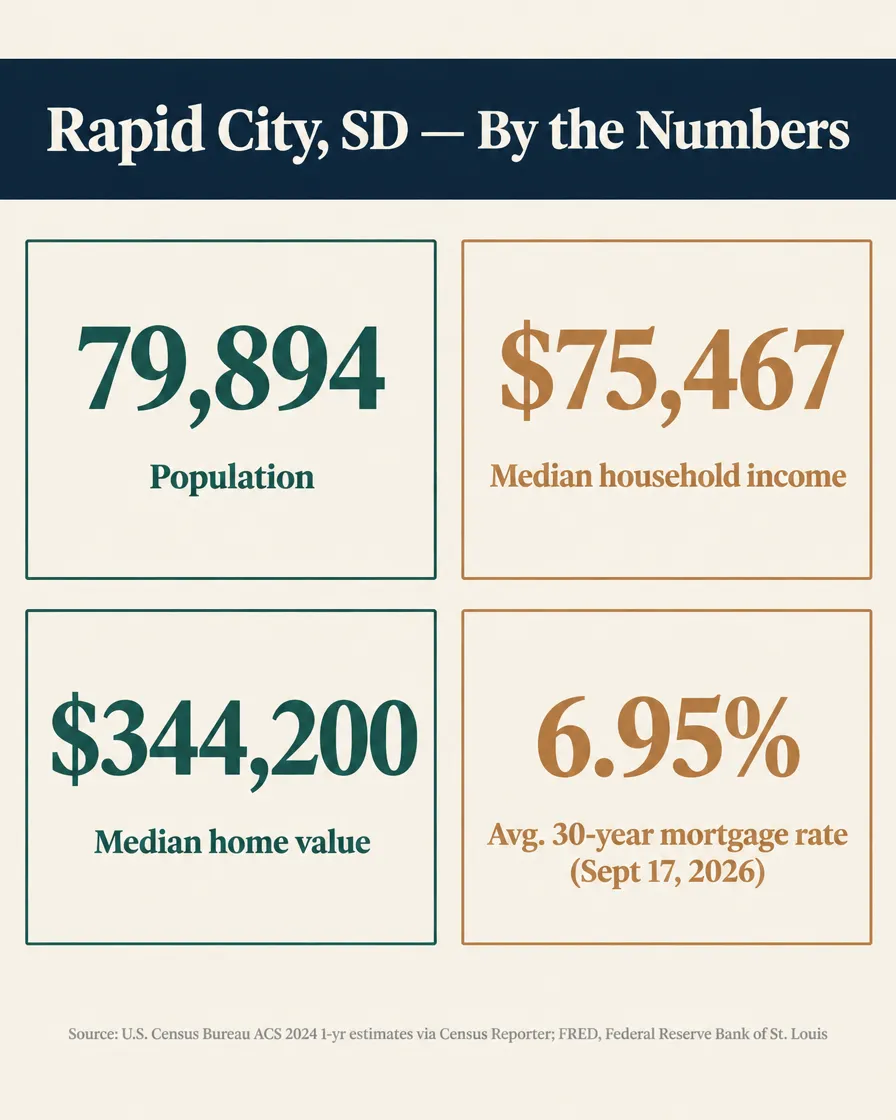
What you get
A coverage target built from your household’s real income, real mortgage balance, and real goals, not a flat multiple borrowed from a national calculator. A side-by-side look at term and permanent options across more than one carrier, sized to that target. And a plain explanation of what changes if your budget doesn’t stretch to the full number today, so you leave with a real plan instead of a reason to put the decision off another year.
Want a number built from your own household, not a national average?
Run the calculator, or talk it through with a local advisor who works for you, not one carrier.
Not ready to talk to anyone yet? Read how it works first and come back when you are. If a health condition has made you assume you’d be turned down or priced out, it’s worth asking rather than assuming: independent agencies see how differently carriers can treat the same file. You can also book a strategy call if you’d rather walk through your own numbers directly.
Frequently asked questions
How much life insurance does a typical Rapid City family need?
It depends on income, debt, and how many years of support your family would need, but for a household earning close to Rapid City’s median income of $75,467, with a mortgage near the city’s median home value of $344,200, the DIME method (Debt, Income, Mortgage, Education) tends to land between roughly $1 million and $1.6 million, depending mainly on how many years of income you choose to replace. The worked example in this guide walks through the exact math, according to U.S. Census Bureau data reported by Census Reporter.
Is the 10 to 15 times income rule a good shortcut?
It is a reasonable sanity check, not a real answer. A flat income multiple ignores your actual mortgage balance, your other debts, whether you have young kids or none, and what you have already saved. The DIME method uses the same four inputs a flat multiple ignores, so it produces a number specific to your household instead of a generic one.
Should I count my employer’s group life insurance toward this number?
Count it as a resource, but not as your whole plan. Fifty-nine percent of private industry workers have access to employer-provided life insurance, according to the U.S. Bureau of Labor Statistics’ March 2025 Employee Benefits in the United States release. That coverage is real, but it is typically a flat amount or a modest multiple of salary, nowhere near a DIME-sized number for most families, and it generally ends the day the job does.
Does South Dakota having no state income tax change the math?
It removes one layer of guesswork. In a state with its own income tax, you would normally shave a percentage off the income-replacement figure to account for the state tax your household currently pays but wouldn’t owe on replaced income calculated the same way. South Dakota levies no state personal income tax, according to the South Dakota Department of Revenue, so a Rapid City family can run the income-replacement piece of the DIME method against gross income without that extra adjustment.
What if I can’t afford the full DIME number?
Buy what your budget supports today and revisit it, rather than buying nothing while you wait for the perfect number. Term life insurance is priced for a set period and a set death benefit, so a smaller policy still pays the full amount if you die during the term. Many families start with a policy sized to the mortgage and a shorter income-replacement window, then add a second term policy later as income grows.
Do I need to include final expenses separately from the DIME calculation?
It’s worth adding as its own line, since DIME’s four letters don’t explicitly include it. The Insurance Information Institute recommends planning for at least $15,000 in final expenses as a minimum starting figure. Our dedicated guide on final expense planning walks through the fuller cost range and how to size that piece specifically.
Does Ellsworth Air Force Base or a military assignment change this calculation?
It adds one more resource to check, not a different method. Service members and some Department of Defense civilians have access to Servicemembers’ Group Life Insurance while on active duty, which is a real resource but, like employer group coverage, it doesn’t automatically follow you into retirement or a permanent-change-of-station move away from Ellsworth. Our guide on what happens to SGLI when you leave the military walks through the VGLI conversion deadline in detail. Run the DIME method the same way regardless, and treat SGLI as a subtracted resource, the same way this guide treats group life at work.
Before you buy
This article is general education, not insurance, legal, financial, or tax advice, and it does not evaluate any specific policy, carrier, or your personal finances. Product availability, features, and rates vary by carrier and state and are subject to underwriting. No coverage exists until a policy is issued and in force. Any guarantees are subject to the claims-paying ability of the issuing insurer. Please review actual policy documents and speak with a licensed agent about your specific situation.
Sources
- Census Reporter — Rapid City, SD (American Community Survey 2024 1-Year Estimates) — accessed September 2026; population (79,894), median household income ($75,467), and median home value ($344,200) for Rapid City city, sourced from U.S. Census Bureau ACS 1-year data
- Data USA — Rapid City, SD Profile — accessed September 2026; independent secondary reading of Rapid City’s population, median household income ($70,870), and median property value ($299,400) from Census data using a different ACS estimate vintage
- FRED (Federal Reserve Bank of St. Louis) — 30-Year Fixed Rate Mortgage Average in the United States (MORTGAGE30US) — week ending September 17, 2026; national average 30-year fixed mortgage rate of 6.95%
- FRED (Federal Reserve Bank of St. Louis) — Median Sales Price of Houses Sold for the United States (MSPUS) — Q2 2026, updated July 24, 2026; national median sales price of new houses sold, $410,700, sourced from the U.S. Census Bureau and Department of Housing and Urban Development
- LIMRA — How to Convert Intent to Action: Closing the Life Insurance Coverage Gap — 2025; U.S. life insurance ownership (51%, down from 63% in 2011) and the estimated 100 million adults who say they need coverage
- U.S. Bureau of Labor Statistics — Employee Benefits in the United States, March 2025 (USDL-25-1464) — published September 25, 2025; 59% of private industry workers have access to employer-provided life insurance
- Insurance Information Institute — How Much Life Insurance Do I Need? — accessed September 2026; minimum $15,000 planning figure for final expenses
- South Dakota Department of Revenue — Individuals: Taxes — accessed September 2026; confirmation that South Dakota levies no state personal income tax
- State Farm — Term Life Insurance — accessed September 2026; illustrative “starting at” term life pricing referenced for context on term coverage affordability
Related reading: How Much Life Insurance Do Sioux Falls Families Need?, How Much Life Insurance Do Aberdeen, SD Families Need?, What Happens to Your SGLI When You Leave the Military?, and Term vs. Whole Life: A 2026 Data-Driven Comparison. See our current term life insurance options, or start with how it works.